Modern analytics teams have no shortage of tools. There are dashboard platforms, cloud data warehouses, notebooks, machine learning workbenches, spreadsheet add ons, and full scale enterprise analytics suites. In that crowded landscape, Alteryx stands out because it is not just a visualization tool, not just a coding environment, and not just a data preparation platform. It sits in the middle of the analytics workflow, helping users move from messy data to repeatable insight with unusual speed.
TLDR: Alteryx is different because it focuses on workflow based analytics: blending, cleaning, transforming, modeling, and automating data processes in one visual environment. Compared with tools like Tableau, Power BI, Excel, Python, or cloud platforms, it is especially strong for repeatable data preparation and operational analytics. It is not always the cheapest or most flexible option, but it can dramatically reduce the time between raw data and business ready output.
What Alteryx Is Really Built For
Alteryx is often described as a self service analytics platform, but that phrase can be vague. More specifically, Alteryx helps analysts and business users build visual data workflows. These workflows can connect to different data sources, clean data, join tables, apply formulas, run predictive models, generate reports, and send outputs to other systems.
The important distinction is that Alteryx is designed around the process of analytics, not only the final chart or dashboard. In many organizations, analysts spend far more time preparing and validating data than they do presenting it. Alteryx targets that pain point directly.
Instead of writing scripts from scratch, users drag tools onto a canvas and connect them in sequence. A workflow might start with a database query, then filter records, join customer data, calculate revenue categories, run a regression model, and export a clean file to Tableau or Power BI. The result is a visible, reusable, and shareable analytics pipeline.
Alteryx vs Tableau and Power BI
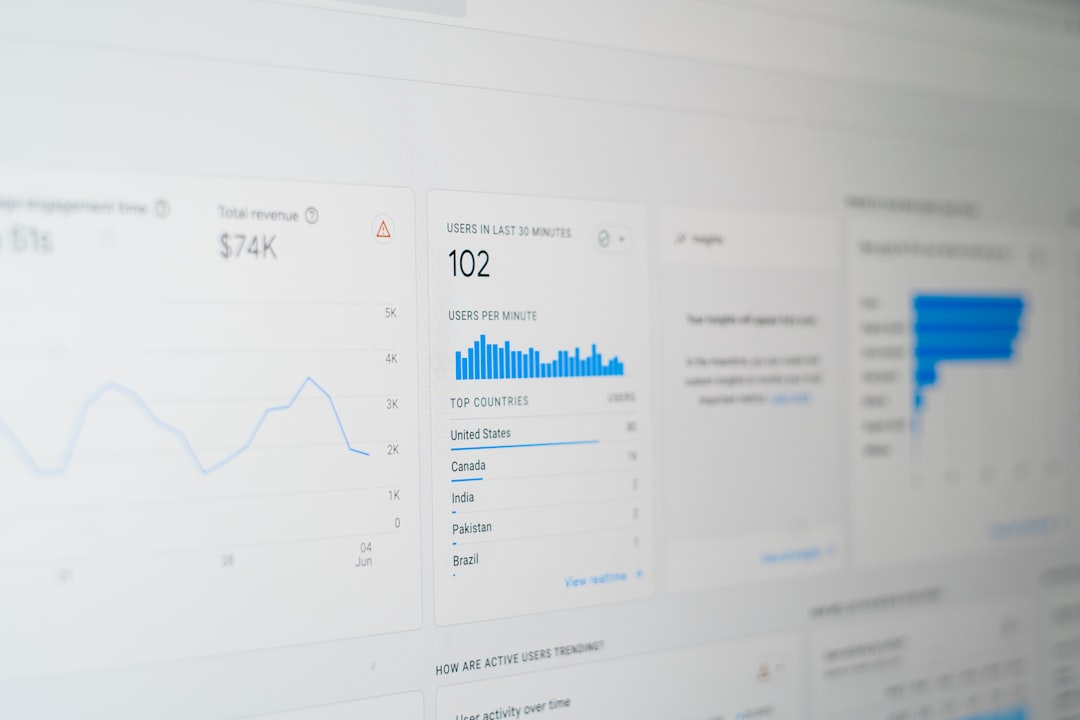
Tableau and Power BI are widely used for business intelligence and data visualization. They are excellent at turning prepared data into interactive dashboards, reports, and executive summaries. However, they are not primarily designed to perform complex data preparation at scale.
This is where Alteryx often complements, rather than replaces, BI tools. Many companies use Alteryx to prepare and shape data before sending it to Tableau, Power BI, Qlik, or another visualization platform.
- Tableau and Power BI: Best for dashboards, reporting, visual exploration, and business communication.
- Alteryx: Best for data blending, transformation, advanced preparation, repeatable workflow automation, and analytical processing.
For example, a sales dashboard may look simple on the surface, but the underlying data could come from a CRM, ERP, spreadsheet uploads, regional databases, and marketing platforms. Alteryx can combine those sources, standardize fields, remove duplicates, and calculate business logic before the dashboard ever loads.
In that sense, Alteryx is often the engine room behind polished BI reporting. Tableau and Power BI show the story; Alteryx helps prepare the story’s raw material.
Alteryx vs Excel
Excel remains one of the most important analytics tools in business. It is familiar, flexible, and available almost everywhere. For one time analysis, small datasets, or quick calculations, Excel is hard to beat.
However, Excel can become risky when workflows grow more complex. Manual copy and paste steps, hidden formulas, inconsistent file versions, and large datasets can create errors. Alteryx addresses many of these problems by making the workflow visible and repeatable.
With Alteryx, an analyst can build a process once and run it again whenever new data arrives. Instead of manually updating multiple spreadsheets every week, the workflow can automatically import fresh files, perform the same transformations, and produce standardized outputs.
The difference is not simply about power. It is about reliability. Excel is often personal and manual; Alteryx is more procedural and auditable.
Alteryx vs Python and R
Python and R are extremely flexible programming languages for analytics, machine learning, statistics, and automation. For technical data scientists, they offer enormous control and access to vast open source ecosystems.
Alteryx takes a different approach. It brings many analytical capabilities into a low code visual interface. Users do not need to write a full Python script to join files, clean strings, run a predictive model, or create a repeatable transformation process.
This makes Alteryx attractive for analysts who understand data and business logic but are not full time programmers. It can also help technical teams by making certain workflows easier to document and hand off to non technical users.
That said, Python and R remain more flexible for highly customized modeling, advanced machine learning, and software style development. Alteryx is not trying to replace every line of code. Instead, it reduces the need for code in common business analytics scenarios.
Many mature teams use both: Alteryx for standardized workflow development and automation, and Python or R for specialized analytical components when needed.
Alteryx vs Cloud Data Platforms
Cloud platforms such as Snowflake, Databricks, Google BigQuery, and Amazon Redshift are built to store and process large volumes of data. They are powerful foundations for modern data architecture. But they are infrastructure oriented; users still need ways to access, transform, analyze, and operationalize the data.
Alteryx can connect to these platforms and act as a user friendly analytics layer. Instead of requiring every analyst to write SQL or build jobs in technical environments, Alteryx provides a visual method for interacting with cloud data.
Its value is strongest when business teams need to do something practical with enterprise data: reconcile transactions, prepare marketing lists, create finance models, validate records, or automate recurring reports.

However, there is an important nuance. For massive data engineering tasks, a cloud native platform may be more efficient and scalable. Alteryx is powerful, but it should be used thoughtfully in relation to the broader data architecture. The best results usually come when Alteryx works with cloud platforms, not against them.
Alteryx vs KNIME and RapidMiner
KNIME and RapidMiner are closer competitors because they also offer visual workflow environments for analytics and data science. Like Alteryx, they allow users to connect tools visually and build analytical pipelines without writing every step in code.
The differences often come down to user experience, enterprise adoption, and business orientation. Alteryx has built a strong reputation for being approachable to business analysts, finance teams, operations teams, and other non engineering users. Its interface is designed to make common data preparation and analytics tasks feel intuitive.
KNIME is known for flexibility and an open ecosystem, while RapidMiner has historically emphasized machine learning and data science workflows. Alteryx, by contrast, often shines in business process analytics: the recurring, practical, cross department work that happens between raw data and decision making.
Organizations choosing among these platforms should evaluate not just features, but adoption. The best analytics tool is the one people actually use consistently and correctly.
What Makes Alteryx Different?
Several qualities make Alteryx distinct in the analytics market.
- Visual, repeatable workflows: Alteryx workflows show every step in a process, making them easier to understand, review, and rerun than many spreadsheet based processes.
- Strong data preparation capabilities: The platform is especially effective for cleaning, joining, filtering, parsing, reshaping, and enriching data from multiple sources.
- Low code accessibility: Business users can build sophisticated workflows without becoming software developers.
- Advanced analytics options: Alteryx includes tools for predictive analytics, spatial analysis, statistical modeling, and optimization, depending on configuration and licensing.
- Automation and sharing: With server or cloud capabilities, organizations can schedule workflows, manage outputs, and share analytics processes more broadly.
Perhaps the biggest differentiator is that Alteryx speaks the language of the analyst. It feels less like a developer platform and more like a practical workbench for people who need to solve business problems with data.
The Role of Automation
Automation is one of the strongest arguments for Alteryx. Many analytics teams are weighed down by recurring manual tasks: weekly reporting packs, monthly reconciliations, quarterly forecasts, compliance checks, customer segmentation refreshes, and operational data extracts.
When these tasks live in spreadsheets or manual SQL scripts, they can consume hours of valuable analyst time. Alteryx allows teams to convert many of these processes into scheduled workflows. That does not only save time; it also improves consistency.
For example, a finance team might use Alteryx to pull ledger data, map accounts, identify exceptions, apply approval rules, and produce formatted outputs. A marketing team might use it to combine campaign performance data, enrich customer records, and generate audience segments. These are not abstract data science experiments; they are everyday business processes that benefit from automation.
Where Alteryx May Not Be the Best Fit
No platform is perfect. Alteryx can be expensive compared with open source options. It may also be less suitable for teams that already have strong engineering resources and prefer code first development in Python, R, SQL, or Spark.
Another consideration is governance. Because Alteryx empowers business users, organizations need clear standards for workflow management, documentation, data access, and quality control. Otherwise, self service analytics can become fragmented.
Performance can also depend on how workflows are designed and where data processing occurs. Moving large datasets unnecessarily can create bottlenecks. Skilled implementation still matters.

Who Benefits Most from Alteryx?
Alteryx is especially valuable for organizations where analysts spend too much time preparing data manually. It is also useful when business teams need more analytical independence but still require repeatable, governed processes.
Common strong use cases include:
- Finance: reconciliations, forecasting, variance analysis, regulatory reporting.
- Marketing: customer segmentation, campaign analysis, data enrichment.
- Operations: supply chain analysis, process monitoring, exception reporting.
- Sales: territory planning, pipeline analysis, account scoring.
- Risk and compliance: audit preparation, anomaly detection, rule based checks.
In these areas, the value is not just analytical sophistication. It is the ability to turn repeated analytical work into a structured process that can be trusted and scaled.
The Bottom Line
Alteryx is different because it focuses on the often overlooked middle of the analytics journey: the transformation of scattered, messy, inconsistent data into something useful. While visualization tools help people see insights, and cloud platforms help store and process massive data, Alteryx helps analysts build the repeatable workflows that make insight possible.
Compared with Excel, it is more reliable and scalable. Compared with Tableau and Power BI, it is stronger at preparation and process automation. Compared with Python and R, it is more accessible to non programmers. Compared with cloud platforms, it provides a practical interface for business users who need to act on data.
The most successful organizations do not treat Alteryx as a replacement for every analytics tool. They use it as a bridge: between technical and non technical teams, between raw data and dashboards, and between one time analysis and repeatable business process. That bridging role is what makes Alteryx uniquely valuable in the modern analytics stack.